
Objective
This field trial assessed the effects of an additional 8 foliar applications of Huma® products throughout the growing season on the yield of Monterey strawberries when compared with the grower's standard crop nutrition program.
Materials & Methods
This trial was set up in a complete randomized-block design conducted during the growing season of April through July in Santa Cruz County, Calif. Two treatment programs were compared: Treatment 1 was the grower's standard nutrition program of controlled-release fertilizer applied at planting and in-season applications of N-P-K; Treatment 2 was the grower's standard plus varied combinations of Huma® products applied foliarly at 8 points during the growing season:
- 04/14: 1 pint/acre each of Vitol®, Breakout®, Lucky 7®, Calcium
2. 04/27: 1 pint/acre each of Vitol®, Breakout®, Lucky 7®, Calcium
3. 05/12: 1 pint/acre each of Vitol®, Breakout®, Lucky 7®, Calcium
4. 05/25: 1 pint/acre each of Vitol®, Breakout®, Lucky 7®, Calcium
5. 06/08: 1 pint/acre each of Vitol®, Breakout®, Lucky 7®, Calcium
6. 06/23: 1 pint/acre each of Vitol®, Breakout®, Lucky 7®, Calcium
7. 07/07: 1 pint/acre each of Vitol®, Breakout®, Lucky 7®, Calcium, Super Nitro®, Super Potassium®
8. 07/21: 1 pint/acre each of Vitol®, Breakout®, Lucky 7®, Calcium, Super Nitro®, Super Potassium®
Treatments were replicated four times, alternating along the length of a strawberry bed. Each replicate plot comprises a single two-plant row bed, measuring 48 inches from center to center. Each replicate plot was 20 feet long. The foliar application was via a backpack sprayer with a wrap-around full coverage boom that simulates a commercial tractor-mounted boom sprayer for optimal coverage.
The first application commenced in mid-April and the applications continued approximately every 14 days throughout the season for a total of 8 applications. Applications 7 and 8 added Super Nitro® and Super Potassium® to Treatment 2.

Figure 1. Total Strawberry Crates Yield per Acre, Grower's Standard (GS) vs. GS + Huma®
Results
Berry counts and weights were recorded twice a week and used to calculate yield in crates/acre. Holding tests were conducted twice a month. Plant vigor, plant diameters, and nutrients were assessed on a monthly basis.
Treatment 2 (Huma Gro®) resulted in better yields than Treatment 1 (Grower's Standard) throughout the season, with an overall season total yield advantage of 860.24 crates per acre (6,881.92 lb/acre) (+ 13%, see Fig. 1). Huma® also performed better in measures of berry counts (+ 9%), berry diameters (+ 4%), and plant vigor (+ 5%). Fruit quality via holding tests (Fig. 2) indicated a higher percentage of marketable fruit (+ 6%) throughout the season for Huma® treated plots.
Plant tissue analysis in May and June showed Treatment 2 plot deficiencies in nitrogen, potassium, and zinc (nitrogen and potassium were supplemented in July).
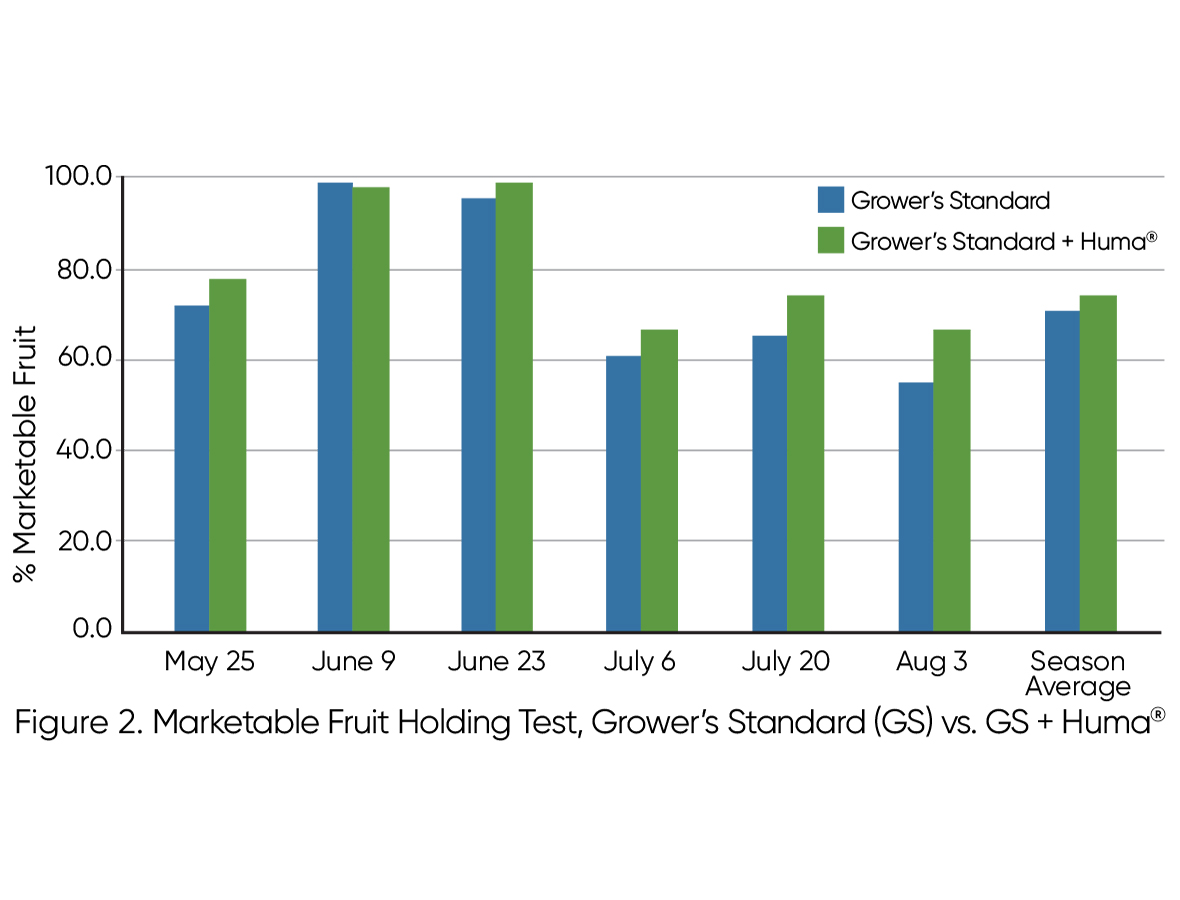
Figure 2. Marketable Fruit Holding Test, Grower's Standard (GS) vs. GS + Huma®
Conclusions
Based on the data collected in this trial, the Huma® treatment program resulted in both higher yields and a higher percentage of marketable yield, resulting in an overall combined marketable yield increase of 19% over the Grower Standard. At the sale price of $6.00/crate, this yield increase resulted in a return-to-the farm increase of more than $5,000.00 per acre. Factoring in the cost of the additional Huma® products applied to achieve this yield increase ($125/ac), the return on investment (ROI) was calculated to be > 4,000%.
It is recommended that in future trials, additional Huma® nutrients be applied earlier in the season to support the increased flowering, fruiting, and berry size achieved with the Huma® products used in this trial
