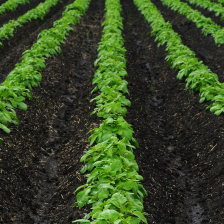
Farmers love to grow corn. Only twice in modern history has corn not held the title of the most-grown crop in the USA. That was in 2018 and (if you count it) 1983, when the government’s PIK program artificially swayed planting practices. Spurred by record fertilizer prices, many projected soybeans would overtake corn last year in their annual acreage tug-of-war. But the allure of maize once again prevailed.
From an emotional perspective, corn sure is fun to grow. It grows fast. It grows tall. You can literally see the output, its ears, take shape right in front of you. And speaking from experience, it’s a rush to see those big numbers, often in the high 200s or 300s, light up your yield monitor. All things being equal, most Midwestern farmers will usually opt to plant corn. That seems to be the case again this year; last week’s USDA report estimates corn acreage to increase 4% over last year, projecting 92 million acres and once again claiming the most-planted crop. Record corn acreage is even projected in Arizona and Idaho. From a rational perspective, 2023 economics are working in corn’s favor. Fertilizer prices have dropped from last year’s record highs and the soybean-corn price ratio – a profitability index comparing the USA’s two most grown crops – sits at about 2.25, well below the average of 2.49. A lower-than-average ratio signals a profit advantage, and even greater incentive, to grow the tall tropical grass. While corn-soybean rotations are popular, especially in the Midwest, they are usually not always at a 50-50 ratio. Land and local market opportunities can have a big bearing. For example, contrary to popular belief, not all of Iowa is flat. Rolling terrain can make soybeans a difficult choice, based on soil erosion concerns. In areas with local hog operations, ethanol plants, and even distilleries, corn can command a greater premium. Will the regenerative agriculture movement – where crop rotation is a pillar – impact corn’s reign? Possibly in the future, although adoption and incentives will need to grow significantly in the Midwest. But a key factor is current markets. Led by animal feed and ethanol production, 86% of US corn is used domestically, whereas nearly one of every two rows of soybeans are exported. Dependency on foreign markets, during today’s uncertain geo-political times, should work in corn’s favor.
For farmers and gardeners alike, frost-free dates have long played a role in when you plant. Based on historical climate data, the spring frost-free date is the average date of the last freeze (when temperatures drop to 32 degrees or below) for any given location. This can often signal a safe time to put sensitive plants in the ground. At my home in West Tennessee, the frost-free date is today. At my family farm in western Illinois, it’s not until April 26. At the Bio Huma Netics home office in Gilbert, Arizona, it’s February 24. Different plants respond to frosts differently. Broccoli – which I planted this weekend based on the frost-free date – is frost tolerant and can withstand temperatures of 26 degrees, while tomatoes are frost sensitive. Likewise, frosts can vary in their intensity. Light freezes (29-32 degrees F) will kill tender crops, moderate freezes of 25-28 degrees are widely destructive to many crops, and anything under 24 degrees is lethal to most crops.
Related Posts

This Week in Ag #58
Yesterday was the 110th birthday of the greatest agriculturalist of all time, Norman Borlaug. The Cresco, Iowa, native’s ground-breaking work to prevent hunger is said to have “saved more lives than any other person who ever lived.” That would be more than one billion lives, according to estimates.

NITROGEN vs. CARBON – NEW AND IMPORTANT INFORMATION
For decades the conventional thinking has been that applications of synthetic nitrogen fertilizers help enhance soil carbon levels by stimulating soil microbes to feed on organic matter from crop residues. New research indicates that, in fact, the opposite may be true.A group of scientists at University of Illinois says that research from the Morrow Plots,

Micro Carbon Technology® for a Greener, Cleaner World
Probiotic Solutions® products are manufactured with our exclusive, proprietary Micro Carbon Technology® that consists of very small carbon-rich molecules. These ultra-fine molecules help efficiently reduce biosolids, improve settleability and promote dissolved oxygen.

